A former Anglican teacher training college received a more positive response from its undergraduates than any other UK university in the National Student Survey, according to analysis.
The 2024 edition of the poll, which at a sector-wide level showed improvements across every measure, also suggests that students at the most prestigious institutions tend to be less satisfied with their experience.
With an overall satisfaction question being again left out for English providers by the Office for Students, the sector regulator that runs the UK-wide survey, Times Higher Education has analysed responses to the 26 questions asked of all UK undergraduates for the provider where they are taught.
This shows that 89.4 per cent of students’ responses across all subjects at Bishop Grosseteste University in Lincoln were positive – the highest rate of all 149 universities in the analysis.
It was followed by Arts University Plymouth, which had a positivity rating of 86.7 per cent – and also scored highest in a controversial question on freedom of expression.
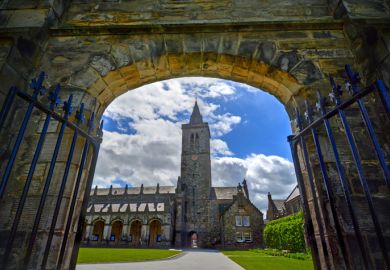
The University of Wales Trinity Saint David and the University of St Andrews, last year’s winner, finished in joint third on 86.5 per cent, and were the top-ranked institutions from Wales and Scotland, respectively.
The questions cover seven different themes, with Bishop Grosseteste scoring highest in four – learning opportunities, assessment and feedback, learning resources, and student voice.
The University of Oxford came top for teaching, Plymouth Marjon University for academic support and St Andrews for organisation and management.
THE’s analysis includes full-time and part-time students at English providers registered with the OfS as universities, plus University of London constituent colleges and universities in Scotland, Wales and Northern Ireland. A small number of institutions were removed because of a low response rate.
The University of Ulster, Northern Ireland’s champion, had an overall positive score of 82.6 per cent.
Although it had just two universities included in the analysis, Northern Ireland had the highest overall positive score of the four nations – 81.5 per cent. It was followed by Wales (81.4 per cent), England (80.5 per cent) and Scotland (79.6 per cent).
The OfS said the data shows that the student experience has not been affected by current financial pressures. However, THE’s analysis suggests those at elite institutions are not as satisfied as others.
The overall positive score across the Russell Group was 78.3 per cent, which was up slightly on the 2023 results, but well behind the score of 81.4 per cent for the rest of the institutions.
The best placed of the Russell Group was the University of Sheffield, which finished in 17th place on 82.2 per cent. At the bottom of the pile among the mission group was the University of Edinburgh, which had a score of only 73.5 per cent.
The OfS flagged that there were minor data quality issues associated with the University of Chester, the University of Hertfordshire and the University of Bedfordshire, but these are not expected to have affected the overall scores.
Register to continue
Why register?
- Registration is free and only takes a moment
- Once registered, you can read 3 articles a month
- Sign up for our newsletter
Subscribe
Or subscribe for unlimited access to:
- Unlimited access to news, views, insights & reviews
- Digital editions
- Digital access to THE’s university and college rankings analysis
Already registered or a current subscriber? Login