Studying sustainability by applying systems thinking to news stories

Educators and students need hands-on activities to help make complex problems of sustainability more tractable. Here I describe an activity designed for teams of students to address a problem of their choice using the online news.
The news media regularly reminds us of society’s wicked problems: climate change, resource depletion, terrorism, poverty and more. Yet these news stories are only the tip of the iceberg; beneath the surface lies a highly complex system of factors that interact and generate these newsworthy events.
To study such problems, teams use systems thinking, looking at the many interrelating factors, to frame the problem, model its causes and design corrective, systems-level actions.
- Educating towards the Sustainable Development Goals
- It’s a game changer: using design thinking to find solutions to the Sustainable Development Goals
- We are not alone: using participatory group activities to engage students in sustainability
Step 1: Find a news item
Teams begin by looking for a news item within the scope of one of the 17 UN Sustainable Development Goals.
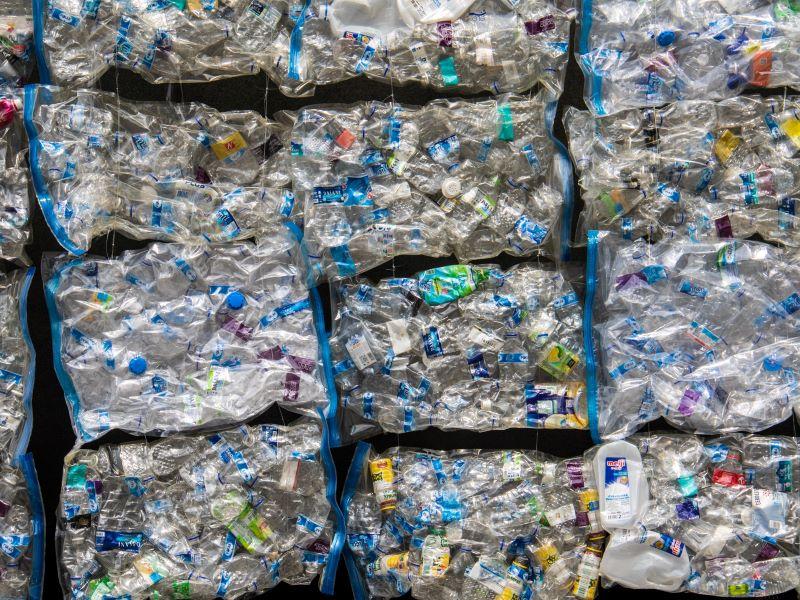
A complex problem of sustainability often exhibits one of six behaviours: something is (1) increasing, (2) decreasing, (3) slowing after a period of strong growth or (4) fluctuating and you are not sure why; (5) actions have been taken in the past to improve a situation to no effect or (6) have had unintended consequences that have made things worse. For example, an online article on the increase in plastic waste.
Step 2: Frame the problem
Framing the problem involves answering two questions: What is changing? How is it changing?
By asking what is changing, teams put their finger on the key variable in the situation. What is it that is increasing, decreasing or simply will not go away? What is it that intrigues or bothers you?
Tip: Use a positive or neutral noun to name a variable, rather than a verb. For example, the quantity of plastic waste.
Once teams agree on what their focus is, they then need to ask: How is it changing?
The objective here is to describe how the key variable has changed over time. We can do this by writing a problem statement. By focusing on a specific behaviour over time, the team frames its thinking for steps 3, 4 and 5.
Tip: A problem statement is made up of three parts: a variable, a behaviour (increase/decrease, magnitude) and a time period. For example, the quantity of plastic waste has increased globally by 5 billion tons since 1950.
Step 3: Tell the story
Now it’s time to flesh out the problem statement and tell the complete story of the problem. What other variables may have contributed to the problem? What else has been increasing or decreasing over the same period?
Variables are the tangible (people and objects) and intangible (feelings) elements of a story that may vary over time. Teams need to cast their net wide and add to the story all relevant variables that may help explain what’s going on.
The story should be two to three paragraphs long.
Step 4: Draw the system
Teams now need to answer the question: Why is it changing?
This involves drawing the underlying system by linking variables according to their cause-and-effect relationships. Different tools are available to do this.
Here, we will use a simple “connection circle”:
1. List the most important variables in the story (10 to 15 variables).
2. Write the variables around a large circle.
3. Find a variable that directly causes another variable to increase (increased consumption of single-use plastics causes an increase in plastic waste) or decrease (more recycling results in less plastic waste).
4. Draw an arrow from the cause to the effect.
5. Add polarities to each arrowhead to describe the relationship: use a “+” if an increase in the first variable is accompanied by an increase in the second; use a “−” if an increase is accompanied by a decrease.
6. Repeat steps 3, 4 and 5 until you can tell the story by moving from one variable to another along the arrows. Once all arrows are drawn, students should check for feedback loops. A feedback loop occurs when a variable is both a cause and an effect in the same causal loop.
If the problem statement describes accelerated growth or decline, there should be a reinforcing feedback loop in the connection circle. For example, increased use of plastic packaging leads to increased consumer convenience, which leads to increased demand for plastic packaging, which leads back to increased use of plastic packaging.
If the problem is one of slowing growth or decline, balancing feedback may be at work. For example, increased use of plastic packaging leads to more plastic waste, which leads to more plastic recycling, which leads to less plastic waste.
Tip: A causal loop has a reinforcing action when there is an even number of, or no, decreasing polarities.
A causal loop has a balancing action when there is an odd number of decreasing polarities.
It’s a good idea to name a loop to remember its role in the system, such as “plastics addiction loop”.
Teams can also identify delays and levels in the system.
A delay is an interruption between an action and its consequences. They can be indicated by two horizontal bars across an arrow.
A level is a variable that accumulates over time such as the volume of plastics in landfill. It can be labelled with a small box.
The finished model should be able to explain the behaviour as described in the problem statement (step 2). At this stage, it’s a good idea for teams to validate and correct their model with domain experts.
Step 5: Look for leverage
The final step in the activity involves looking for the system’s leverage points. These are places in the system where actions can yield the greatest impact. Leverage can be found in feedback loops, delays and levels.
How can reinforcing loops be slowed or accelerated? How can balancing loops be created to monitor or counteract other variables? How do delays affect decision making? How can levels be monitored to avoid reaching tipping points?
Now it’s time for teams to be creative. They should design a set of system-level actions to influence the (undesirable) behaviour described in step 2. For example, imagine alternative forms of packaging, such as plantable or edible packaging, to provide greater relative consumer convenience to influence the plastics addiction loop.
Cameron Guthrie is a professor in decision and systems sciences at Toulouse Business School.
Additional Links
A fully worked example is provided at www.thinkwicked.com
Get additional resources including templates, how-to guides and examples at www.thinkwicked.com
Follow Cameron’s “Thinking Complexity” MOOC on iversity


